
This is a unique tool available only from SigmaGuru.
Download now free for 30 days To continue using, Pay USD5 / INR250 via paypal to [email protected] I want to improve my process CpCpk |
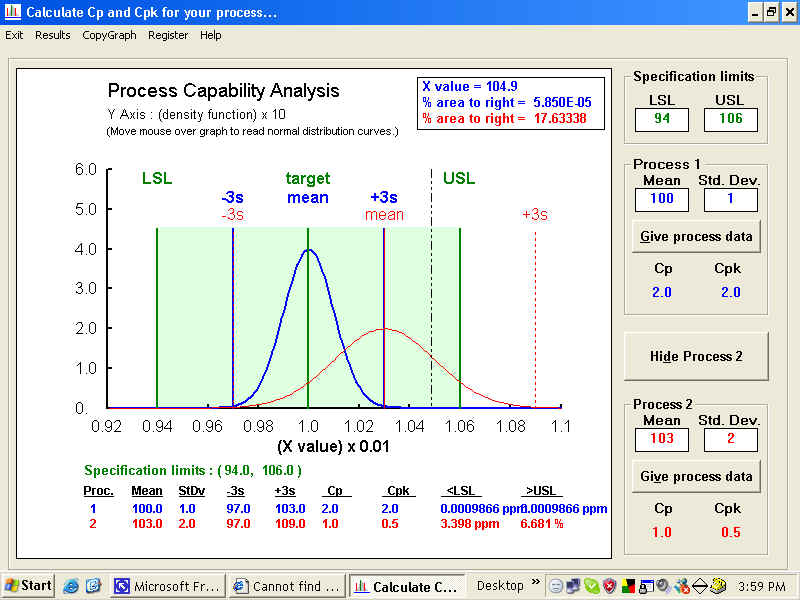
You can print such before and after process improvement picture in your reports.
You simply enter your measurements (either directly or copy from another excel file.) and USL and LSL values and see the graphical relationship + Mean and Standard Deviation values for the 2 processes displayed instantly. The graph window can be quickly copied and printed wherever you want. In your report, for example. What if calculations can be easily made..... A must for all working for process improvement / six sigma. |
Contact SigmaGuru now - Whatsapp - +91 94235 07631
